
In our previous article, we read about Feature Scaling and the most common technique used to perform feature scaling i.e. Standardization.
Another important and commonly used technique is "Min-Max Scaling" or "Normalization".
As the name suggests, Min-Max Scaling is the technique where the variables are scaled based on their Minimum and Maximum values.
Formula Used:-
 |
| Min Max Scaling Formula |
Unlike Standardization, mean is not used here. Rather the Minimum and Maximum values for each variable are used to find the new scaled value.
The logic used here is to subtract the Minimum value from each value and divide it by the difference between maximum and minimum values.
Features of Min-Max Scaling
1. Mean is not centred at 0:-
Since in Min-Max scaling, we use the Minimum and Maximum values for scaling each variable separately thus, the mean may or may not get centred at 0. We can see this in the below example, where the mean for all variables is greater than 0 but less than 1 as data is ranged between [0,1].

2. Variance varies across the variables:-
Changing the distribution of data changes the variance of the data also.
3. May not preserve the Original shape of Distribution:-
When we subtract any value from the original values, the original distribution gets changed thus changing the shape of the Distribution.
4. Minimum and Maximum values are scaled between [0,1] or [-1,1]:-
Since all the data is scaled based on the data range for each variable thus, it is scaled between the [0,1] or [-1,1] range.
5. Does not preserve the outliers:-
Unlike Standardization, here outliers are not preserved as the data is scaled based on Minimum and Maximum which changes the outliers also.
Practical
Let's implement it by ourselves to understand it much better
1. Importing the necessities:-
 |
| Importing libraries for Min-Max Scaling |
2. Getting Data Insights
For getting any meaningful insights from the data we first need to be familiar with the data. i.e No. of Rows/Columns, Type of data, What that variable represents, their magnitude etc. etc.
To get a rough idea of our data we use the .head() method.
 |
| Boston Data Overview |
To know in detail about the dataset, i.e what each variable represents we can use .DESCR() method.
 |
| Description of Boston House Data |
To further get the mathematical details from the data, we can use the .describe() method.
 |
| Mathematical Description of Boston House Data |
3. Scaling the Data
sklearn package has the MinMaxScaler method which can be used to implement the MinMax Scaling of our dataset.
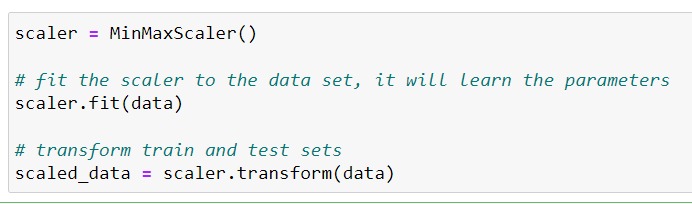 |
| Implementing MinMax Scaling |
As the data has been scaled, we can check the Minimum and Maximum values for each variable.
 |
| Minimum and Maximum values |
Also, if we want we can check the data range.
 |
| Data Range |
4. Verifying the Scaling
To verify the end result first, we need to convert the scaled_data to a pandas dataframe.
 |
| Converting scaled data to dataframe |
Next, we need to verify if the data has been scaled or not. For which we need to use the .describe() method again.
Scaled Data:-
 |
| Describing Scaled Data |
We can notice here that the Minimum value for each variable has been reduced to 0 and the Maximum value has been set to 1.
Original Data:-
 |
| Describing Original Data |
Summary
We have studied MinMaxScaling, a technique commonly used for Feature Scaling. Here is a Quick Note on the technique:-
1. Does not centre the mean at 0.
2. Variance varies for each variable.
3. Shape of the original distribution is not preserved.
4. The minimum and maximum values are brought in the range [0,1] or [-1,1].
5. Sensitive to Outliers.
6. Preffered in case of No Outliers in data.
Happy Learning... !!
Comments
Post a Comment