Hope you are following up with us and by now you have become familiar with Jupyter Notebook, the basics of NLTK and Python functions.
Now, we will explore some more complex topics in NLTK, starting with statistics we will go through the loops and then learn how to apply conditions to the texts.
From the previous article, we know how to find the size of text, and how to access tokens based on indexes. But how to find out which tokens are highly repeated in the text or are there any specific tokens that the author has repeated many times to focus or emphasize on a particular topic.
Yes, this is very simple and can be done easily by using frequency distribution. Frequency Distribution can be understood simply as counting the repetition of different tokens in a text. Eg. In this paragraph, we have tokens 'frequency', 'distribution', and 'can' present twice while 'understood', 'counting', 'repetition', 'using' etc have just appeared once. See the below image to understand it better..
Calculating the repetition of each token and then maintaining a separate table or dictionary(in terms of Python) indicating the times you came across that particular token. Doing this manually can be a tedious job, but the same thing can be done within seconds using 'FreqDist()' function as shown below:-
Here the keys are the various tokens present in our text whereas the values are the repetitions of each token in the text.
Let's find out how many different tokens were present in our text...
Here we have used "keys()" function to list out all the keys in the frequency distribution and then used "len()" function to find the length to know the different numbers of tokens present in the distribution.
Fun Act:- Let's find out how many times the token "world" was repeated in the entire text. (P.S. We did this in the
previous article, here it's just another way to do it)
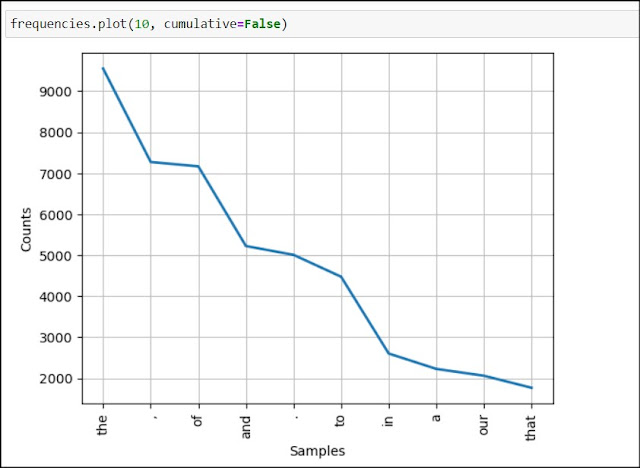
Enough of working with numbers, now let's try to visualize
The above image shows a graph of the count of values for first 10 tokens appearing in the text frequency dict. Whereas the below graph is a cumulative representation of the same where the count for each token is added to the previous count and thus we can see that more than 45000 times the first 10 tokens are repeated in the text.
Great..!! so we were able to get the count of repetition of each token in the text. How about finding a word that is not repeated and appears just once in the entire text. Interesting... right..!! these words that appear just once in the text are known as "Hapex".
A simple function "hapexes()" in the nltk library can help us find out these hapexes in the text. As shown below:-
We can see that out of a total of 10025 tokens around 4255 tokens are such that appeared just once in the text.
Fun Time:
Let's have some and try experimenting with what we have studied so far.
- Finding words with more than a certain length
Using a simple "len()" function in for loop we can find out the tokens with more than 16 characters.
- Finding tokens with more than certain number of repetitions
here we have used 2 different conditions using the "and" operator, which checks tokens with more than 16 characters and that are repeated more than 5 times.
A collocation is a combination of words that frequently appear together. For instance, "fast food" is a collocation, while "quick food" doesn't have the same natural ring to it. Collocations tend to resist substitution with words that have similar meanings. For example, "speedy food" doesn't quite capture the same meaning or sound as natural as "fast food."
We can use a simple function "collocations()" to find these bigrams repeated more often in the text.
Here is a list of other functions that you can perform using frequency distribution.
- freq_1 = FreqDist(text) ==> To create a frequency distribution of the given text
- freq_1.inc(text) ==> Increment the count for the given text
- freq_1['token'] ==> Returns the count of times a given token appeared in the text
- freq_1.freq('token') ==> Returns the frequency of given token
- freq_1.N() ==> Total number of tokens in the text
- freq_1.keys() ==> returns a list of all the tokens present in the text in descending order
- for token in freq_1 ==> for loop for frequency distribution
- freq_1.max() ==> to find the token with the highest number of appearances
- freq_1.tabulate() ==> create a tabular chart for the frequency distribution
- freq_1.plot() ==> to plot the frequency distribution
Apart from these, you can also try using some basic python string functions and see what you can get. Here is a list of functions you can experiment with:-
- token.startswith('N-Gram')
- token.endswith('N-Gram')
- N-Gram in token
- token.islower()
- token.isupper()
- token.isalpha()
- token.isalnum()
- token.isdigit()
- token.istitle()
where token is
this and N-Gram means
this
Git Hub Repo:- NLP Repository
Citations
Bird, Steven, Edward Loper and Ewan Klein (2009), Natural Language Processing with Python. O’Reilly Media Inc.


Comments
Post a Comment