Welcome back, friends..!! We are back with another imputation technique which is a bit different than the previous techniques we studied so far, & serves an important role that we knowingly/unknowingly have been skipping throughout the previous techniques.
We studied many techniques like Mean/Median, Arbitrary Value, CCA, Missing Category, End of tail, Random Samples. If we notice all these techniques were good enough to Impute the Missing Values but the majority of them lacked to mark/flag the observations that were having values/and were imputed.
Thus, we bring here the technique of Missing Indicator that was designed with the sole purpose of marking or denoting the observation that was/is having a missing value. This technique is mostly used together with one of the previously defined techniques for imputation.
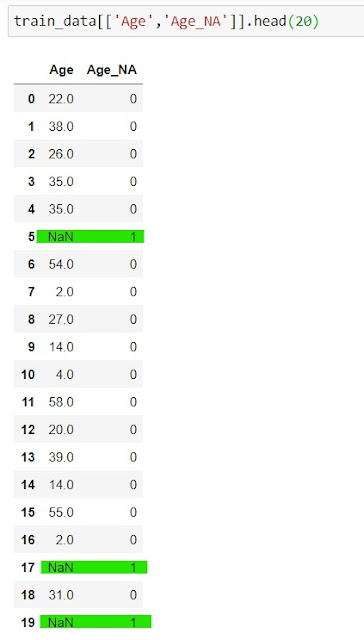
In simple terms, if we have to explain the technique, then in this technique we use another column/variable to maintain a flag(binary value 0/1, true/false) mostly to denote the observation having a missing value.
So, now let's go ahead and have a look at the assumptions that we need to keep in mind, advantages and the limitations of this technique, post that we will be getting our hands dirty with some code.
Key Points to Remember
- We assume here that the data is not MAR(Missing At Random).
- Every missing data has something to say, i.e missing data is predictive in nature.
- Always used with another Imputation technique.
- We can use this technique for both Numerical and Categorical Variables.
Advantages
- It is easy to implement.
- This technique can capture the importance of "missingness".
- No assumptions are made on data.
Limitations
- It expands the feature space.
- This technique can not be used alone, and we need another technique to impute the missing values.
- In case of an observation having many missing values across the variables, we need to use many missing indicators, that may end up being identical or very highly correlated.
Code
1. Importing the Libraries and the data.
 |
| Importing the Libraries and the data |
2. Checking the percentage of missing values in each column.
 |
| checking the percentage of missing values |
3. Performing Imputation
 |
| Performing Imputation |
4. Checking Imputation.
 |
| Checking Imputation. |

Comments
Post a Comment