Introduction
Machine Learning, Data Science, Data Analytics. etc. etc. are the terms that are on hype in the current world and every individual is drawn toward these fancy fields, not only because there is a high demand for these technologies but also the things we can achieve from them.
Data is the next-generation fuel for industries, has seen a huge surge in its importance in the past few decades because with the data we can avail all the super-intelligence kind of stuff. All the super-intelligence stuff like knowing our customers better in large, predicting future events, building intelligent systems have been made possible with the data.
Thus, as we can harness the power of data, more and more industries are trying to capture as much data as they could to enhance their products/services. Hence. the demand for technologies and jobs dealing with data is on rising. This rising demand is attracting more and more individuals towards itself.
But with rising new ways to capture data, in most cases, industries use multiple methods to gather the data from various places. This leads to rising in other new issues with data like Missing Data, Outliers etc. We have already studied Missing data and techniques to handle them in the past few articles. Here we are going to focus on Outliers, another big issue in Machine Learning and Data Science.
What are Outliers?
Outliers, a great thing about this is, neither the term 'Outliers' nor its meaning is foreign to us. We all are familiar with it, can see it in daily life also, the only thing is that we never paid much attention to it as we pay to our social media accounts(pun intended).
So, let's have a look at the formal definition of it, then we will explain it in depth.
As Wiki says:-
"In statistics, an outlier is a data point that differs significantly from other observations."
Thus, outliers are the observations or things very distinct from the others in the group. Yes, you heard it right, every time everywhere we hear it from everyone "Be Different", do not follow the crowd. If you do follow this advice, you are an outlier.
Great..!!! isn't it... being different is great, but why did we call it an issue in Machine Learning. That's because when we are trying to analyse some data, all we want is to look for patterns, similarities and relationships between them, that means if we have too many outliers in our dataset then it won't be possible for us to study it and gather some insights from it. Being that said, we can not rule out the fact that there can't be exceptions, these exceptions become outliers in our datasets & disturb our analysis.
Let's have an example to explain it more...
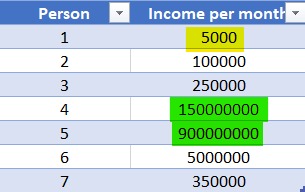
Suppose, we are analysing the average net worth of each Indian, it includes from the poor begging to the richest tycoons in the world from India(a sample data shown below).
 |
| Sample Income data |
Here, we can see two incomes marked in Green are exceptionally high and one marked in Yellow is exceptionally low. These three persons are known as Outliers. The impact of this is that if we take the average of it now, it will be 175892500 which is nowhere near the correct value. The interesting part is, we can not rule these green outliers as null and void because these are the real income of some of the biggest tycoons in India.
Thus, to avoid these situations and making a waste model in the end, we need to handle them in the very starting only. Don't worry we will discuss outliers here in-depth.
Reasons for outliers in datasets
Now, when we have seen what are outliers. The next big question is how it is introduced in the datasets?
There are many reasons for outliers, we are going to list a few of them here:-
=> Manual Errors:- A lot of data collection is done manually either through public forms or surveys, this can lead to wrong values being captured if proper validations are not in place. Eg. capturing age as 100 instead of 10 in a survey of children's.
=> Not an Outliers:- Like in the sample income data, there are chances that the value captured is the correct value. but it doesn't match with the group.
=> Mechanical Glitches:- This is another common way that introduces outliers in the system. When a mechanical or digital devices malfunctions it records some abrupt values which can be outliers. Eg. a faulty fuel meter in a test car, that always shows a full tank, this can lead to the wrong calculation of milage and thus an outlier.
=> Others:- Other methods can introduce these outliers, mostly different for different ways of capturing the data. Eg. Server errors, wrong validations, human errors etc. etc.
Why Identify Outliers
How To Identify Outliers
Enough of talking... Time to learn some techniques that can help us out with identifying outliers and deciding what can be done with them. So, without wasting much time, let's directly jump to the main part.
For convenience, we have grouped these techniques if 3 groups:-
1. Mathematical:- First and most preferred way by statisticians to identify the outliers is using a z-score or IQR.
a. z-score:- a fancy term for knowing the difference between the mean and the data point. In technical terms, it is the Mean/Standard deviation.
Mean
Z-score = ------------------------------
Standard Deviation
Here, ideally, the values outside the 3rd standard deviation are considered as outliers, we may vary it as per the dataset. Calculating z-score is simple using the stats module of scipy.
We have calculated the z-score of the "Fare" column and listed down the rows having z-score more than the 3rd standard deviation.
 |
| z-score |
b. IQR:- Inter-Quartile Range. Again a fancy term for a simple concept. The data is divided into 4 quarters, i.e 4 equal parts containing 25% each. Ideally denoted by Q1(25), Q2(50) & Q3(75).
Values before Q1 & Q3 +/- IQR are treated as outliers here.
 |
| IQR testing |
2. Graphical:- By using graphs these values can be easily calculated without many calculations as a visual is 100 times better than math/text. 2 ways that we are going to discuss here are:-
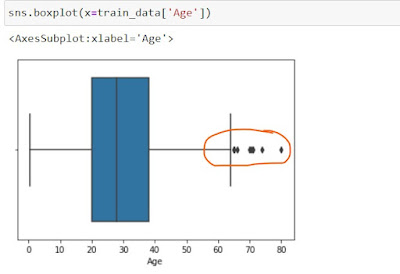
a. Box Plot:- A simple technique is to create a box plot of the data, the outliers will be kept outside the IQR range of the column.
 |
| Box Plot showing Outliers |
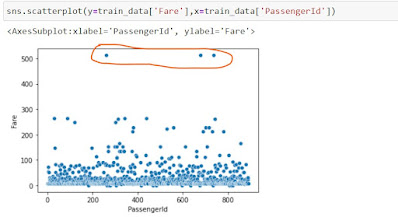
b. Scatter Plot:- Scatter plots are another great technique to find the outliers distributed across the space.
 |
| Scatter Plot showing Outliers |
3. ML Model:- This is a special case and can be used only with very special cautions. This implies using a standard dataset without any outliers to train a Machine Learning Model, post that we use this model over a new dataset to find any outliers present in it or not.
Caution has to be paid while selecting the first dataset used for training, it should be well structured without any outliers or impurities.
We will demonstrate this technique in a separate article.
Methods to handle outliers
We have covered almost every detail necessary for outliers, one last thing that remains now is the techniques to handle the outliers.
Since we need to discuss these techniques in detail, and it would increase the length of the article.
So, let's study them in separate articles below...

Comments
Post a Comment