Introduction
The grass is not as green as it can be seen from outside when it comes to Machine Learning or Data Science. The end result of designing a perfect hypothesised Model is rarely possible not because ML is not powerful, but there is a long tedious and repetitive work of cleaning, analysing and polishing the dataset is involved.
One thing that we need to take care of in this Cleaning and improving process is "The Outliers". This is a mere term with a simplistic meaning but is troublesome to handle/manage the data when introduced in it.
Still unaware of Outliers, How they are introduced? and How to identify them? Read it Here > Mystery of Outliers <
Let's begin with the first technique to Handle outliers.
Trimming the Outliers
The most simple and easiest way to handle/avoid any problem that we are taught from the very beginning is to "Remove It".
We are also going to follow the same that we learned from birth in case of outliers, i.e. we are going to get rid of the problematic data. This process of removing the data which are most likely to be outliers is known as "Trimming the Outliers". Sometimes few Geeks also like to say it "Truncating Outliers".
This is a simple technique, very very simple technique, as simple as pressing the "Delete" button on the keyboard. So, let's have a look at the Advantages and Disadvantages of this technique before we perform a practical demo.
Advantages
This technique is very similar to us when it comes to advantages:-
- It is Quick in implementation.
- It is Easy to implement.
- And both Quick and Easy to grasp.
Disadvantages
Coming to the negative part of this technique.
- Outlier for one variable can contain useful information for another variable.
- We can land up removing a large chunk of the dataset, in case of too many outliers.
- We need to define the cutoff for being an outlier by ourselves.
Practical
1. Loading the Libraries
 |
| Loading libraries |
2. Loading the Boston Dataset
 |
| Loading Boston House Price dataset |
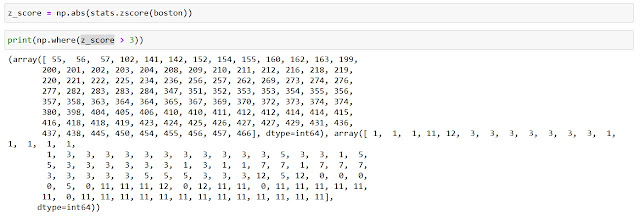
3. Calculating z-score
 |
| Calculating z-score |
4. Trimming the data
5. Verifying
 |
| Verifying the final data |


Comments
Post a Comment