Welcome to the 2nd Post in the series of Data Visualization, one of the most loved/followed topics of India — IPL (Indian Premier League) (Part 1)
In this, we will be focusing on the various analysis based on the Teams.
Overview of the Data Set
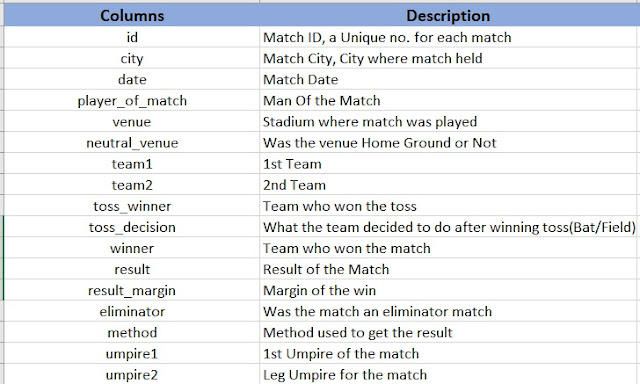 |
| Description of columns of IPL Dataset |
Let’s Begin by Checking Data in these columns
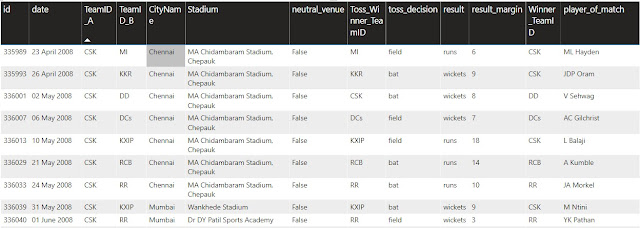 |
| IPL Data Set 1 Overview |
 |
| IPL Data Set 2 Overview |
Moving towards the most interesting part, Visualize the dataset and relations.
Let's begin by having a look at the total wins by each Team since 2008...
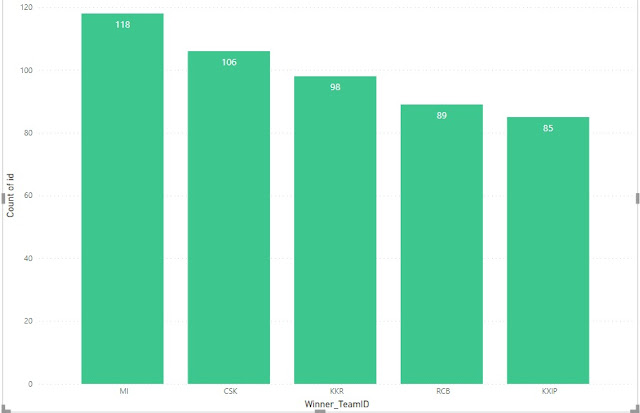 |
| Team VS No. of Match Wins |
The above Bar chart shows the top 5 teams with the most number of Match Wins across all the seasons. Surprisingly, RCB in among the top 5 still hasn’t won any IPL Season.
Now Let’s have a look at these wins
 |
| Team VS Wins based on runs/wickets |
The above Bar chart is a detailed version of the previous graph which shows the top 5 teams with the most wins divided by wins achieved batting first and batting second.
Blue Bars represent the wins by batting first whereas Brown Bars represent the wins by batting second and the thin pale yellowish line is of tied matches.
We can notice here MI has won more matches while batting first, whereas RCB and KKR are good at chasing. Apart from them, CSK is quite balanced by winning almost equal matches.
One of the other most important aspects in analyzing the win of a Team is the ground. So, let's see how many of these wins were at a Neutral Venue.
 | ||
| Wins based on ground Neutrality |
The above graph is another representation of the Matches won by each team based on ground neutrality.
Blue colour represents a non-neutral ground i.e. ground is a Home ground of one of the team, whereas brown is for a neutral location.
We can see CSK, Punjab and RCB are among the top teams to win most No. of matches on a neutral ground.
Another thing that can impact a teams win is the toss, we have seen toss as a major factor in winning the match. Let's see does the same stands true here also or not.
 |
| Winners by Toss |
Pheewww… it looks complicated but relaxes it's quite easy... Let’s explain this graph in a bit of detail and make it simple...
These 5 bars are of our top 5 teams(MI, CSK, KKR, RCB and KKR). And the different colours are of the various teams in IPL. These colour notation for each team is defined above in the graph, a few of these are
— Brown for MI, Blue for CSK, Dark Blue for KKR, Purple for RCB and Light Blue for Punjab.
Now, let's try to read the graph and try to get some insights…
As we can see there is a big part of the same colour in each bar for the team they denote, Like in the 1st bar MI has won 61 matches after winning the toss. Similarly, there is a high ratio of the win for each team after winning the toss.
Now, we can conclude that winning a toss is an important factor in winning the match.
Let’s see which team has the most number boundaries… A game-changer factor... Boundaries… the adrenalin of IPL…
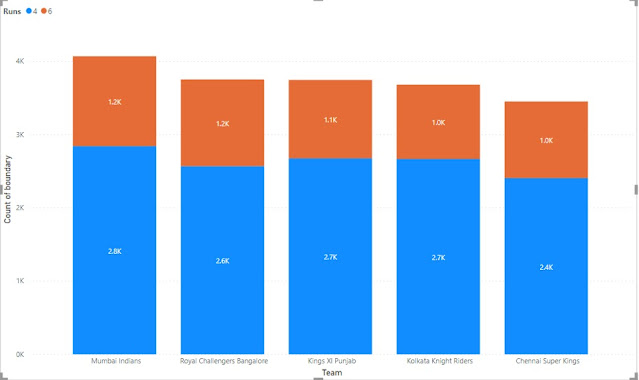 |
| Teams VS Boundary |
The above graph shows the team and the number of boundaries scored by them, these bars are of 2 different colours, blue represents the 4s and brown represents the 6s.
We can see the team ranking gets changed here, CSK which was the 2nd best team till now in our analysis has moved to 5th position and RCB has jumped to 2nd. MI still holds the 1st position.
What we can conclude for here..!!!
Not always big-hitting leads to wins, other factors are also responsible for the wins like strike rotation and sensible batting.
Till now we have done some analysis for the batting part, but now let's see some graphs based on Bowling. After all, games can’t be won only by Bat, it needs a Ball too…
Let's have a look at the team which has taken the most wickets
 |
| Teams VS Wickets |
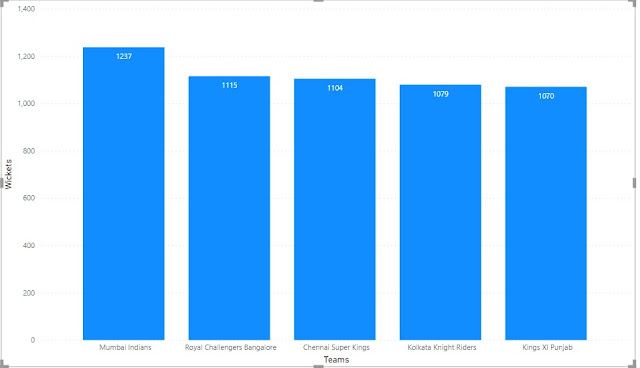
The above graph shows the top 5 teams with max. wickets across all the seasons of IPL.
Still the same 5 times but with shuffled positions except for MI, seems like they have reserved their position with an all-around performance.
Now let's see what is the most preferred way to get out.
 |
| Teams VS Dismissal Way Count |
Another colourful graph of the article... Don’t worry it's easy... I have filtered the graph to the top 5 teams(as usual) and the top 6 ways to lose your wicket.
As we can see, the colour denotation of each type of wicket is defined above the graph namely bowled, caught, caught and bowl, lbw, stumped and run out.
What can we infer from the above graph..!!!
Most of the wickets were lost by getting Caught(similar for all teams) and this count is way higher than any other count. No doubt it has to be highest as it's the game of hitting.
The second big reason is getting Bowled, another way to lose a wicket when you try to hit.
The rest of the reasons also have a very small share in the same. But do have Big Impacts on the Game.
Another important factor related to bowling is the extras, one loves it when runs come for free…
 |
| Teams and their extras |
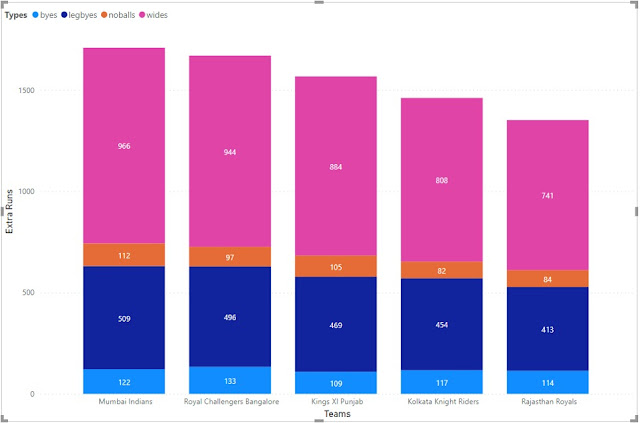
In the above graph, we can see various types of extras bowled by each team and the total run given by each type.
We can see Wide balls are a clear winner here in case of leaking runs. But a point to note here is that runs given via NO balls is quite less for each team
Also, MI holds its Pole position here also…
Now let's have a look at the most famous stadiums for IPL
We can see the top 10 stadiums for the IPL matches by the no. of matches played.
M Chinnaswamy Stadium is the most played stadium. NO doubt why it's the most preferred stadium for T20 as it has the most batting-friendly pitch. Also, Eden is the 2nd most loved ground might be due to the high seating capacity.
More in IPL Part 2… Stay tuned...
I hope you liked the article, please like and leave a comment on how you liked the post, your views, points for improvement Or anything specific you would like me to analyze for you.
Always Happy to Help
Thank you A lot Guys… See You soon with some more interesting analysis…


Comments
Post a Comment