Discretisation or Binning, the process of dividing the data into equal intervals or bins. Yes, we have studied this explanation but how we can do it?
Still, this question keeps running into our minds... Sit back and relax we have got you covered...
Here we are going to learn simple and easy techniques that we use in our daily life also -- dividing the data into equal intervals. i.e we divide the into N-equal groups of the same width(gaps).
 |
| Equal Width Binning Example |
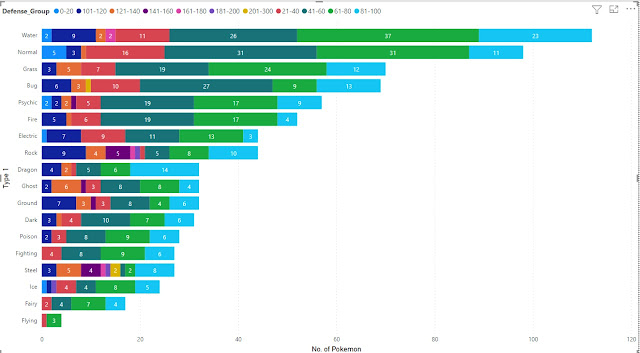
Let's understand it better using the above example(image). Here we had values ranging from 0-300, quite a large width or range for doing any analysis and visualisation. Thus, we decided to divide the data into equal widths of 20(bins of 20), i.e 0-20,21-40,41-60* and so on.
* We used 21,41,61,... because we wanted to make clear that range is inclusive of the upper limit.
Doing so we were able to group the data into 15 bins which not only made it easy to visualize but also helps in analysing the data better and easily.
How to decide Bin Widths?
So by now, we know that we have to divide the data into some bins of equal widths, but how do we decide what should be the perfect size for our bins.
Don't worry, we can solve this issue just with a simple formula. Here We Go:-
Size of Bins = (Maximum Value - Minimum Value) / (Number of Bins)
Here, the number of bins can be decided by the user, that is suppose our data is very widely spread we can select less number of bins to accommodate more data per bin if data is not much spread we can select a high bin count for a good distribution of data.
Eg:- Let's understand it better from our above example.
Maximum Value = 300
Minimum value = 0
Number of bins we want = 15
Using above formula, (300 - 0) / 15 = 20.
Thus, we had bins of size 20. (0-20,21-40 and so on).
Practical
1. Importing the Libraries
 |
| Importing Equal Width Discretiser, libraries and data |
2. Data Visualization
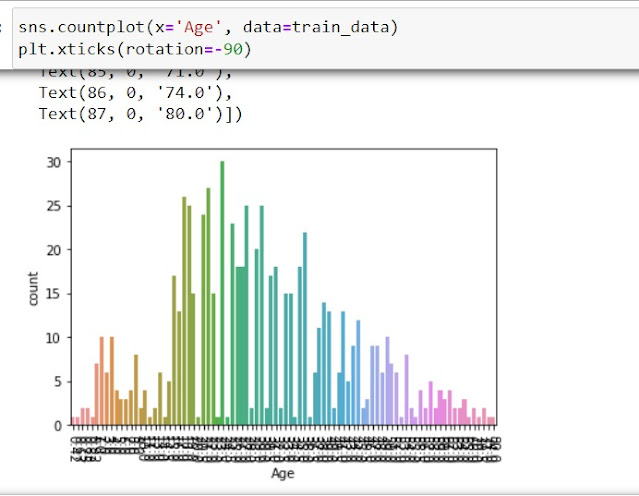
 |
| Data Visuals before Binning |
3. Using the Equal Width Discretiser
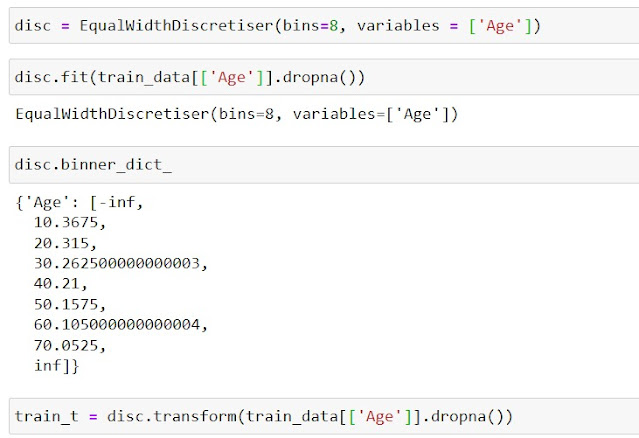
 |
| Initializing the Equal Width Discretiser |
4. Visualizing the End Result
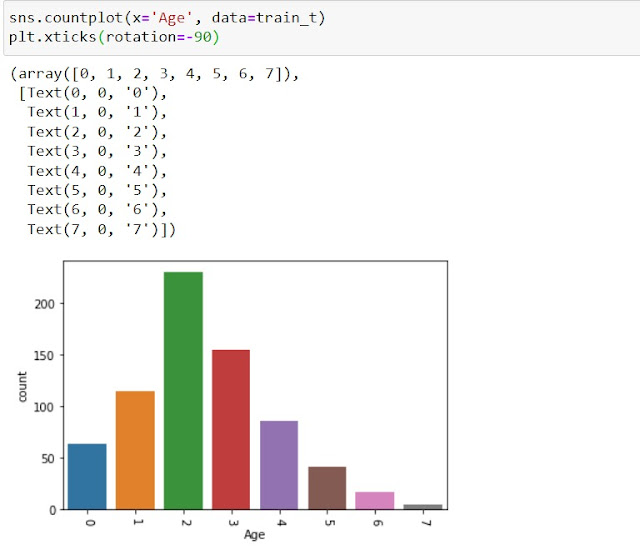
 |
| Equal Width Discretisation Result |
We could notice here that the shape of the original graph is retained in the final result, i.e. higher values in middle, least on the right end. Only we have reduced the number of data presented on the X-axis of graph.

Comments
Post a Comment